A new feature launched by the state Bureau of Crime Statistics & Research could help law enforcement and residents reduce the risk of crime, and keep their communities safer.
The hotspot map, launched by BOCSAR, shows key areas for crimes like motor vehicle theft, break and enter dwelling, malicious property damage and domestic violence assault down to the street level.
Every statistic tells a story, and analysis by the Cowra Guardian revealed high rates of malicious property damage, which includes vandalism, spray painting and tagging, or slashing tyres, across the Central Business District and in key locations across North and South Cowra throughout the last financial year.
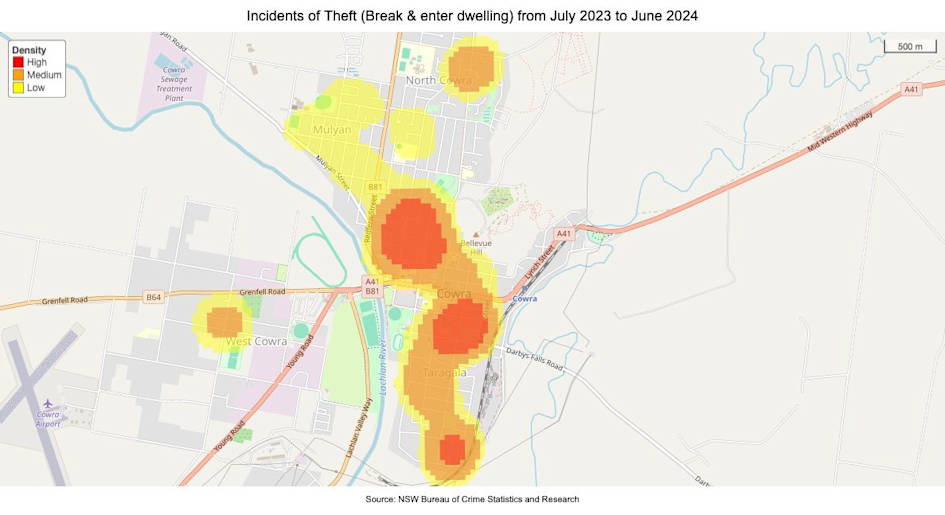
Homes near Phillips and Keswick Street, along with Denman and Vaux Streets and Thomas Street were all listed as ‘high density’ hotspots for theft (break and enter dwelling) from the period from July 2023 to June 2024. Break and enter offences for non-dwellings were reported to most commonly occur on the Young Road near Waratah and Lyall Streets, and across Kendal Street.
“Crime mapping shows us where crime occurs and helps us understand why crime occurs in certain areas,” a senior analyst for BOCSAR told the Cowra Guardian.
Latest Stories


“The distribution of crime across a region is not random and many factors influence where crime occurs. Information on where crime occurs can improve crime prevention efforts by helping to identify or anticipate at-risk places, times and people, inform the allocation of policing resources and victim services, and help design tailored crime prevention strategies specific to communities,” she said.
It is important to note that due to the small population of Cowra, just one or two crimes can turn an area from a ‘low level’ hotspot to a ‘high density’ hotspot. Mapping tools can be broken down to individual offences, helping provide greater insights into the exact number of crimes occuring in the region, along with state averages and comparisons.
“While all the hotspots have a substantially high concentration of crime (compared to NSW averages) the red areas indicate the highest density hotspots, the dark orange areas indicate medium density hotspots and the yellow-orange areas indicate low density hotspots. Knowledge of where crime is concentrated can help improve crime prevention policies and programs. For example, it can help us to anticipate at-risk places, times and people; direct law enforcement resources; allocate victim services; design the most suitable crime prevention strategies; and so forth,” the analyst explained.
Crime hotspot data in Cowra could be seen as specific to certain areas, and even to businesses, but the spokesperson for BOCSAR said the intention for mapping data is simple: “Crime maps show us where crime occurs.”
“BOCSAR’s overarching aim is to provide accurate, objective, and accessible information about crime such as hotspot maps to the community. In doing so, we hope to inform and assist with the development and implementation of strategies which reduce crime and provide a more efficient, effective and equitable justice system,” she said.
The hotspot map, along with further crime mapping tools can be viewed online at www.crimetool.bocsar.nsw.gov.au/bocsar/.